
“It’s great that you finally decided to learn about the stock market and trading. However, as you have started to learn trading, you may sometimes face difficulties due to some basic terms of trading. In fact, these terms can be confusing at first. Therefore, it’s very important for you to understand all the terms of the stock market.
If you want to be a pro trader someday, knowing these terms will be super helpful. Plus, understanding them makes you look like a pro and gives you confidence.
why it is important to know for you: –
- It helps you understand what’s going on: Like learning a new language, you need the basic words to understand what people are talking about. Without knowing the terms, trading can be confusing and overwhelming.
- It helps you make smart decisions: If you don’t understand the terms, you might make bad trades. Knowing the basics helps you understand the risks and rewards of different trades.
- It helps you avoid costly mistakes: Misunderstanding a term could lead to losing money. Knowing the basics helps you avoid these kinds of mistakes.
- It helps you communicate with other traders: If you want to talk to other traders or read about trading, you need to know the terms they use.
- It builds your confidence: When you understand the basics, you’ll feel more confident in your trading decisions.
- It’s the first step to becoming a pro: Just like any skill, you need to learn the fundamentals before you can become an expert. Knowing the basic terms is the first step to becoming a successful trader.
- A share
A share represents ownership in a company. When you buy a share, you own a small part of that company. This ownership means you can earn money through dividends or by selling the share if its value increases when the company grows.
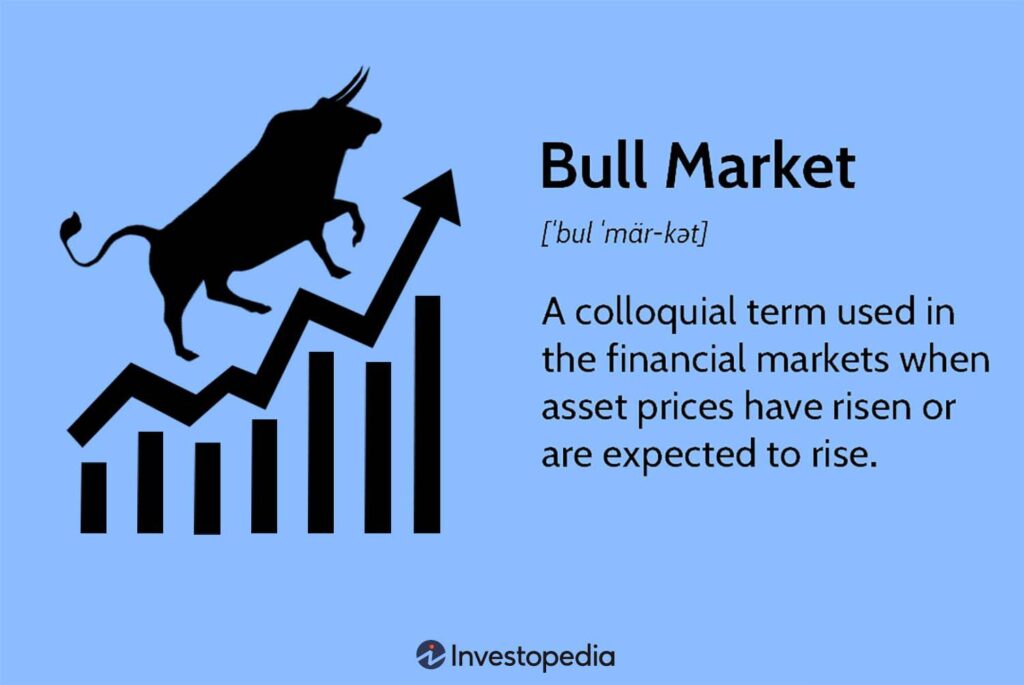
2. Bullish market (uptrend)
A bullish market is when prices of stocks or other investments are rising or expected to rise. People feel confident about the economy and believe prices will keep going up. Investors buy more, hoping to make profits. It shows a positive mood, with strong demand and growing business activities. It is also known as UPTREND
3. Bearish market (downtrend)
A bearish market is when prices of stocks or other investments are falling or expected to fall. People feel negative about the economy and believe prices will keep dropping. Investors may sell their shares to avoid losses. It shows a cautious mood, with lower demand and slowing business activities. It is also known as DOWNTREND
4. Intraday trading (Day trading)
Day trading or intraday trading is when people buy and sell stocks on the same day to make quick profits. Traders try to earn money from small price changes during the day. All trades are closed before the market ends, so no stocks are held overnight.
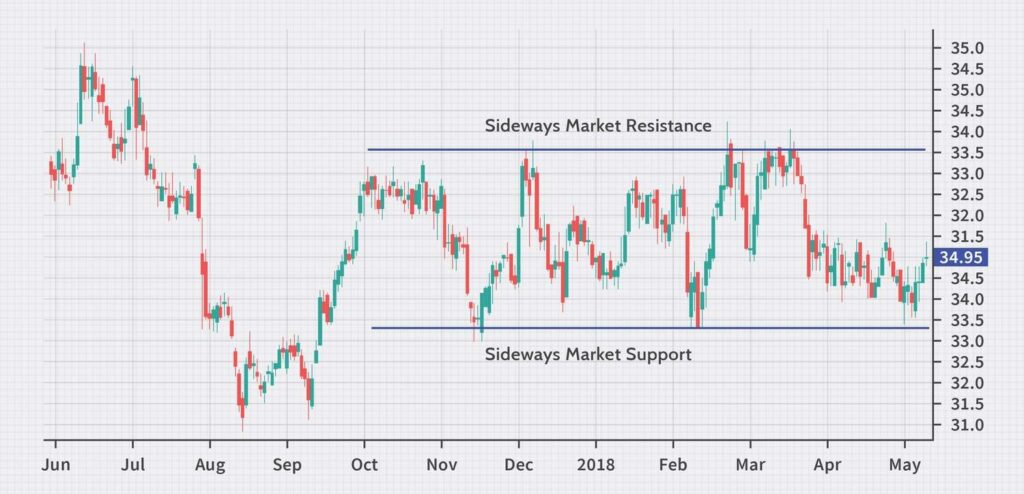
5. Sideways market
A sideways market in trading happens when the price of a stock or asset moves within a narrow range, without going clearly up or down. In other words, it means the market has no strong trend, and prices stay stable for a period. As a result, traders often wait for a clear direction before making big moves.
6. Reversal
A reversal refers to a situation when the price of a stock or asset changes direction. For example, if the price was going up and then starts going down, that’s a reversal. It can also happen when prices stop falling and start rising. Reversals signal a shift in market trends.
7. volatility
Volatility in the stock market means how much and how quickly stock prices change. If prices move up and down a lot in a short time, the market is highly volatile. If prices change slowly or stay steady, it’s less volatile. Volatility shows the level of risk and uncertainty in the market.
Types of trading: Which One Is Right for You?
8. Liquidity
Liquidity in trading means how easily you can buy or sell a stock or asset without changing its price too much. In simple terms, if a stock has high liquidity, it’s easy to trade quickly because many people are buying and selling it. On the other hand, low liquidity means fewer trades, making it harder to sell without lowering the price.
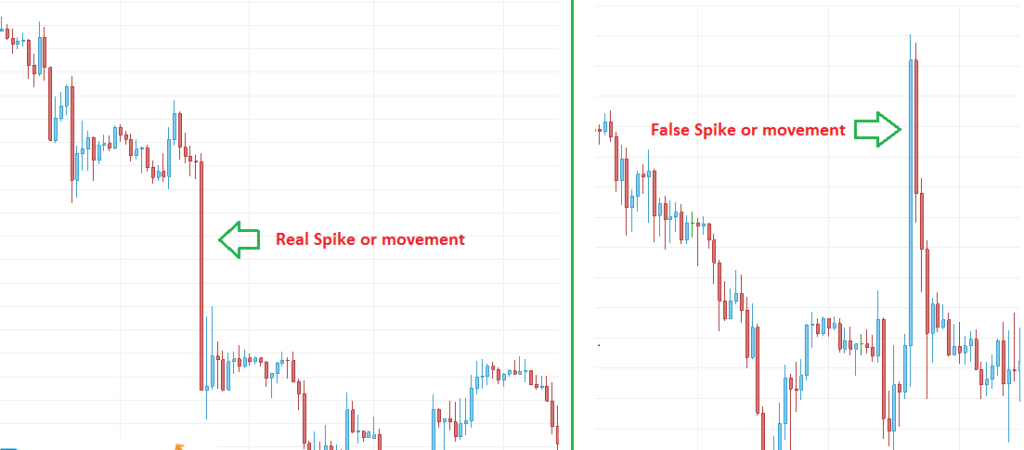
9. Spike
A spike in trading is a sudden and sharp change in the price of a stock or asset. It can be a quick rise or drop in price, often caused by big news, strong demand, or panic selling. Spikes happen fast and may not last long, showing sudden market reactions.
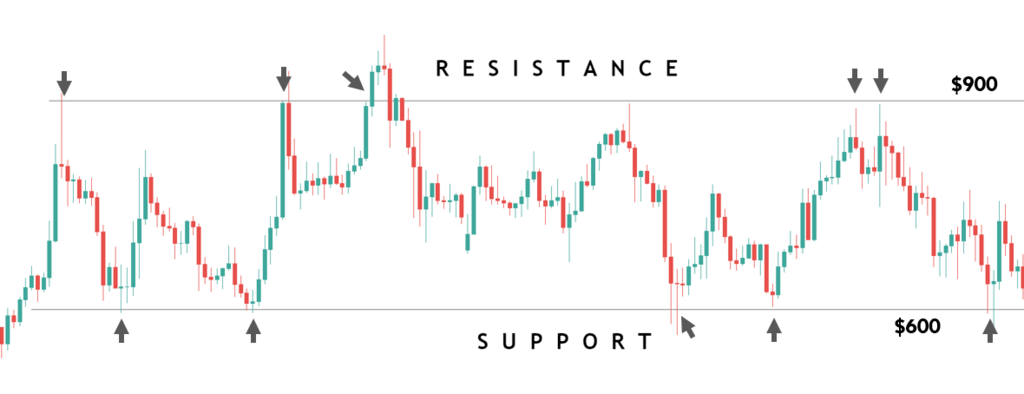
10. Resistance level
The resistance level in trading is a price point where a stock or asset struggles to go above. It happens because many traders sell at that price, stopping it from rising further. If the price breaks through this level, it might keep going higher, showing strong buying interest.
11. Support level
The support level in trading is a price point where a stock or asset stops falling because many traders start buying at that price. It acts like a floor that supports the price. If the price drops below this level, it might fall further, showing weak demand.
12. Buy
Buy means to purchase a stock or asset because you believe its price will go up in the future. Traders buy to make a profit by selling it later at a higher price. It’s the first step in trading, showing confidence that the value will increase.
13. Sell
sell means to trade a stock or asset for money. Traders sell when they believe the price might drop soon or to take profits if the price has already gone up. Selling is done to avoid losses or secure gains after a successful trade.
14. Stop loss
A stop-loss in trading is an order to sell a stock automatically when its price falls to a certain level. It helps traders limit losses if the market moves against them. For example, if you buy a stock at $100 and set a stop-loss at $90, it will sell automatically if the price drops to $90, protecting you from bigger losses.
15. Target
a target is the price level at which a trader plans to sell a stock to make a profit. It’s like a goal price where the trader believes the stock will reach. For example, if you buy a stock at $50 and set a target at $60, you plan to sell it when the price hits $60 to earn a profit.
16. Margin
margin is the money borrowed from a broker to buy more stocks than you could with just your own money. It allows traders to trade larger amounts with a small investment, aiming for higher profits from small price movements.
For example, if you have 1,000 and the broker offers 5x margin, you can trade stocks worth 5,000. However, if the trade goes against you, losses can also be higher, so margin trading carries more risk.
17. Pull back
A pullback in trading is a temporary drop in the price of a stock or asset during an overall upward trend. It happens when prices fall slightly after rising but then continue to go up.
Traders see pullbacks as short-term pauses where they can buy at a lower price before the price rises again. It’s different from a reversal because the overall trend (upward) remains the same.
18. Stock exchange
A stock exchange is a marketplace where people can buy and sell stocks, bonds, and other securities. It provides a safe and regulated platform for companies to raise money by selling shares to investors.
Examples of stock exchanges include the New York Stock Exchange (NYSE), National Stock Exchange (NSE) of India, and London Stock Exchange (LSE). Prices of stocks on the exchange change based on supply and demand.
19. National stock exchange (NSE)
The NSE stands for the National Stock Exchange of India. It is one of the largest stock exchanges in India where people buy and sell stocks, bonds, and other securities.
The NSE is known for its fully electronic trading system, which makes trading fast, easy, and transparent. The most popular index of the NSE is the NIFTY 50, which shows the performance of the top 50 companies listed on the exchange.
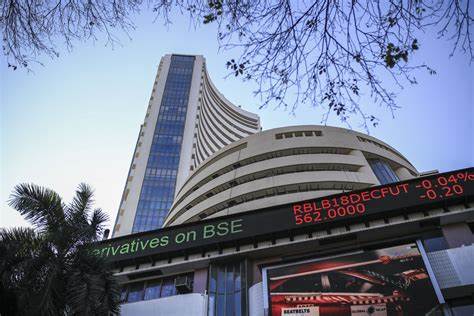
20. Bombay stock exchange (BSE)
The BSE stands for the Bombay Stock Exchange, which is the oldest stock exchange in Asia, established in 1875 in India. It is a place where stocks, bonds, and other securities are bought and sold.
The main index of the BSE is the SENSEX, which tracks the performance of the top 30 companies listed on the exchange. The BSE provides a platform for companies to raise money and helps investors trade and invest in the stock market.
21. Nifty 50
The NIFTY 50 is the main stock market index of the National Stock Exchange (NSE) of India. It represents the top 50 largest and most actively traded companies from various sectors in India.
The NIFTY 50 shows how the overall stock market is performing. If the NIFTY 50 goes up, it means most top companies’ stock prices are rising, showing a strong market. If it goes down, it shows prices are falling, indicating a weak market.
Traders and investors use the NIFTY 50 to track market trends and make investment decisions.
22. Sensex
The SENSEX (short for Stock Exchange Sensitive Index) is the main stock market index of the Bombay Stock Exchange (BSE) in India. It represents the top 30 well-established and financially strong companies listed on the BSE from various sectors.
The SENSEX shows the overall performance of the stock market. If the SENSEX goes up, it means the stock prices of these top companies are rising, showing a growing or strong market. If it goes down, it means prices are falling, signaling a weak market.
Investors use the SENSEX to track market trends and understand the health of the Indian economy.
23. Limit order
A limit order in trading is an instruction to buy or sell a stock at a specific price or better. For example, if a stock is $100, you can set a buy limit order at $95. The order only completes if the price drops to $95 or lower, ensuring you don’t pay more than you want.
Simple Example:
- You want to buy a stock, but you think it’s too expensive at $100.
- You decide you’ll only buy it if it drops to $95.
- You set a buy limit order at $95.
- If the stock price falls to $95 or lower, your order goes through. If it doesn’t, nothing happens.
24. Market order
A market order in trading is an instruction to buy or sell a stock immediately at the current best available price. It guarantees the order will be filled quickly. For example, if a stock is $100, you buy it right away at the closest available price, which might be slightly higher or lower.
25. Indicators
Indicators in trading are tools or calculations based on price, volume, or other market data that help traders analyze and predict market trends. These indicators are lagging tools because it just tells that what has been happened in the market. you can help these tools to know only past performance of the market and predict the market for future. Example of indicators are RSI, MOVING AVERAGE, MACD etc.
26. Volume
Volume is a type of indicator that, in simple terms, is used to know the total number of shares or contracts traded for a stock or asset during a specific time period. As a result, it shows how much trading activity is happening.
why volume matters
- 📈 High volume means lots of interest and can confirm strong price movements.
- 📉 Low volume means less interest and may indicate weak or uncertain price moves.
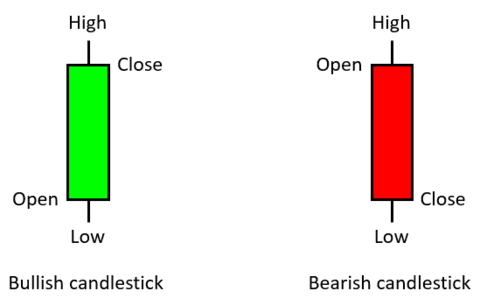
27. Candlestick pattern
A candlestick pattern in trading is a visual way of showing the price movement of a stock, currency, or other assets during a specific time period. Each candlestick represents four key pieces of information:
- Opening price
- Closing price
- Highest price
- Lowest price
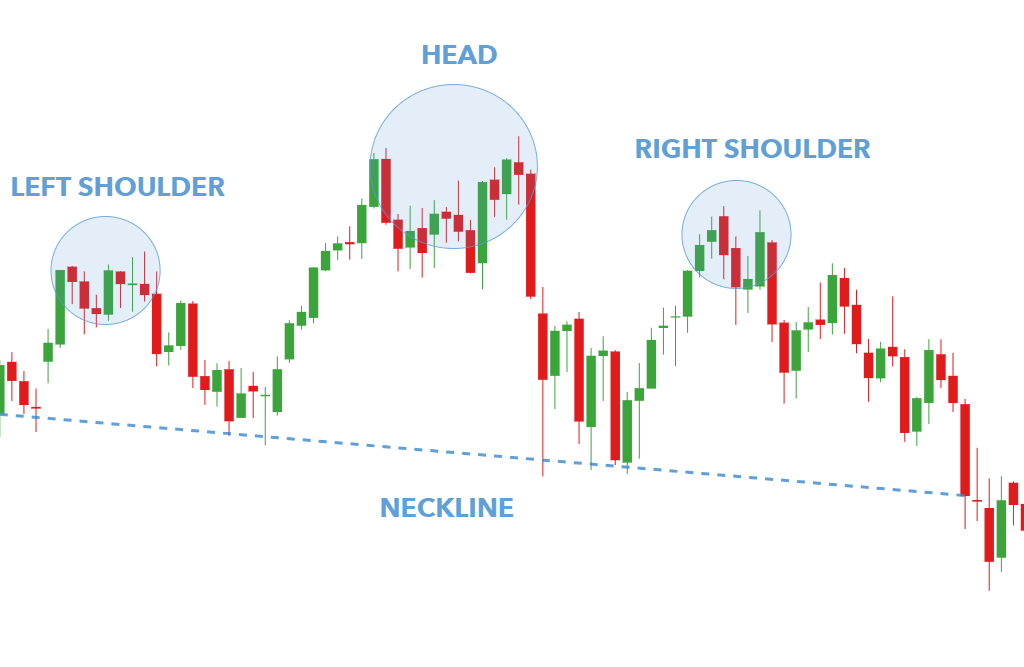
28. Chart patterns
Chart patterns in trading are shapes or formations on a price chart that help traders predict where the price might move next. They show how the price of a stock or asset has moved over time and can signal whether the price will go up, down, or stay the same.
common chart patterns
- Head and Shoulders: May signal that the price will reverse direction.
- Double Top and Double Bottom: Show potential trend reversals.
- Triangles (Ascending, Descending, Symmetrical): Indicate price breakouts.
- Flag and Pennant: Suggest the current trend will continue.
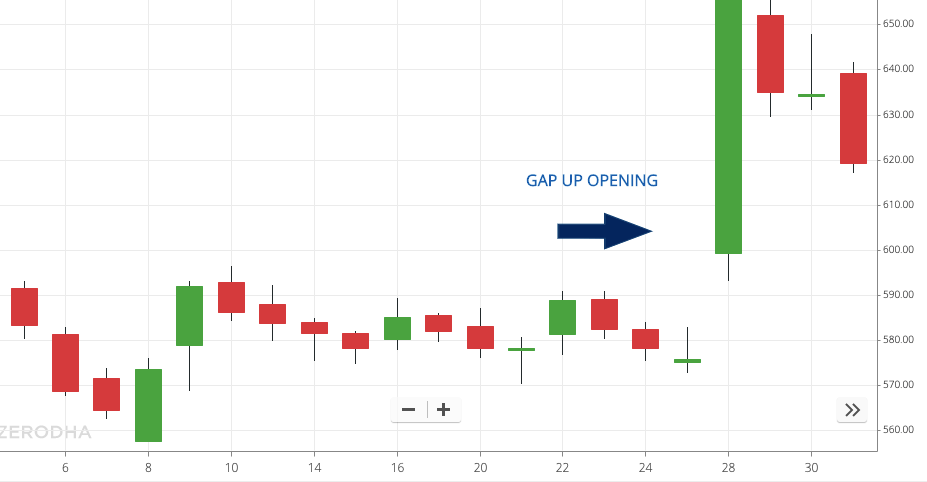
29. Gap up
A gap up open in trading happens when a stock’s opening price is higher than its previous day’s closing price, with no trading happening in between at the gap. This creates a “gap” on the price chart. Example If a stock closed at 100 yesterday but opens at 105 today, it’s called a gap up open because the price jumped without trading between $100 and $105.
30. Gap down
A gap down opening in trading happens when a stock’s opening price is lower than its previous day’s closing price, with no trading occurring in between at the gap. This creates a visible “gap” on the price chart. Example – If a stock closed at $100 yesterday but opens at $95 today, it’s called a gap down opening because the price dropped without trading between $100 and $95.